Documentation
Use this document as a way to quickly get started with Dependency Grid for Jira
Dependency Grid in a Nutshell
Dependency Grid is a simple yet powerful visualization tool that offers a comprehensive overview of your Jira dependencies a glance.
Starting Dependency Grid
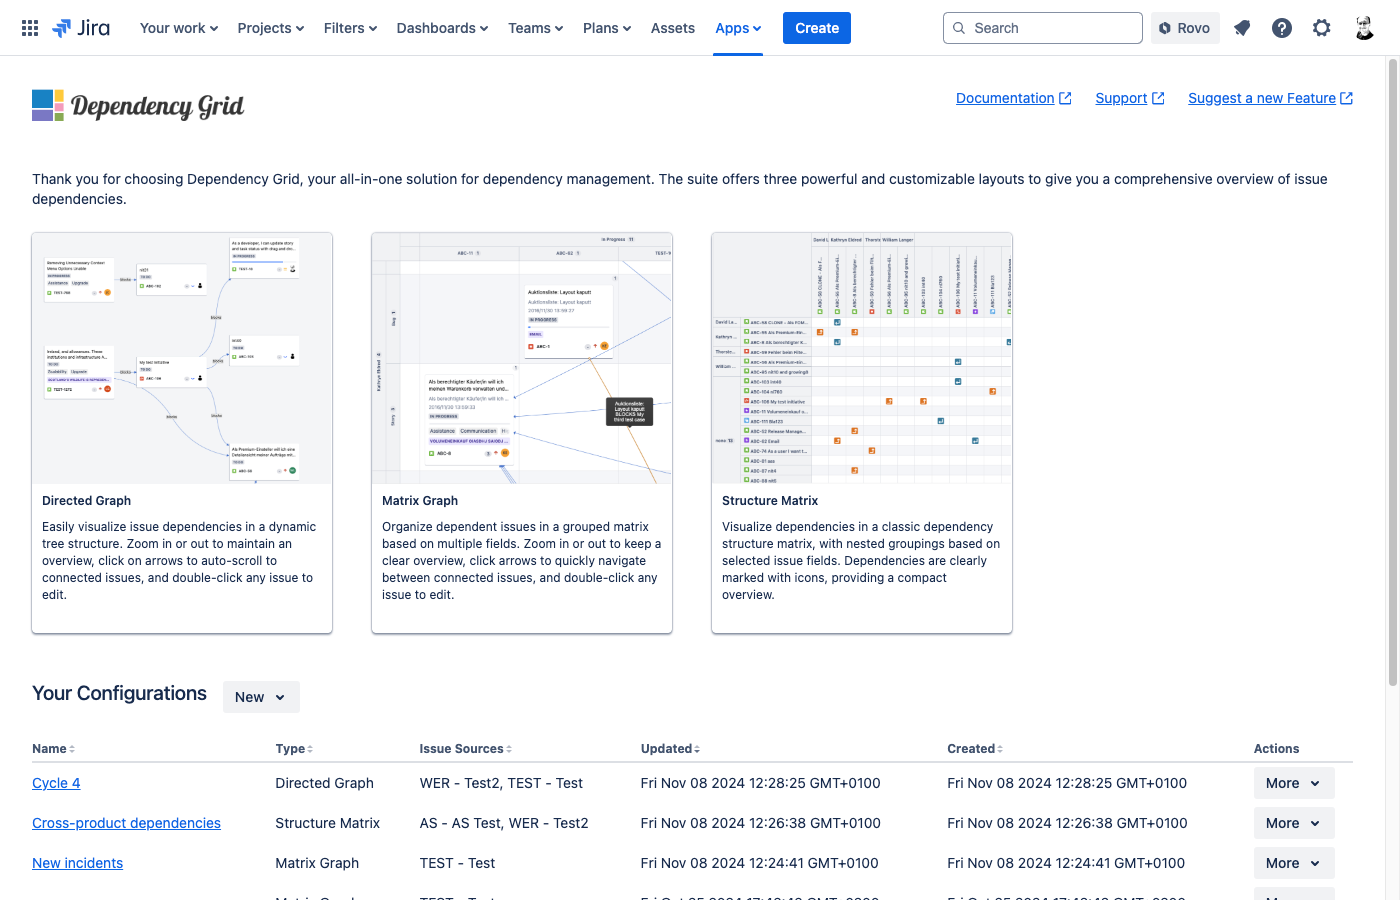
Dependency Grid can be obtained through the Atlassian Marketplace. Once the app is installed, navigate to the "Apps" menu in the Jira main navigation header. Dependency Grid will be displayed as shown below. In addition to explanatory content, the start page offers quick access to all saved configurations.
Dependency Grid supports theming. When switching between themes, such as from light to dark mode, please note that a page reload may be required.
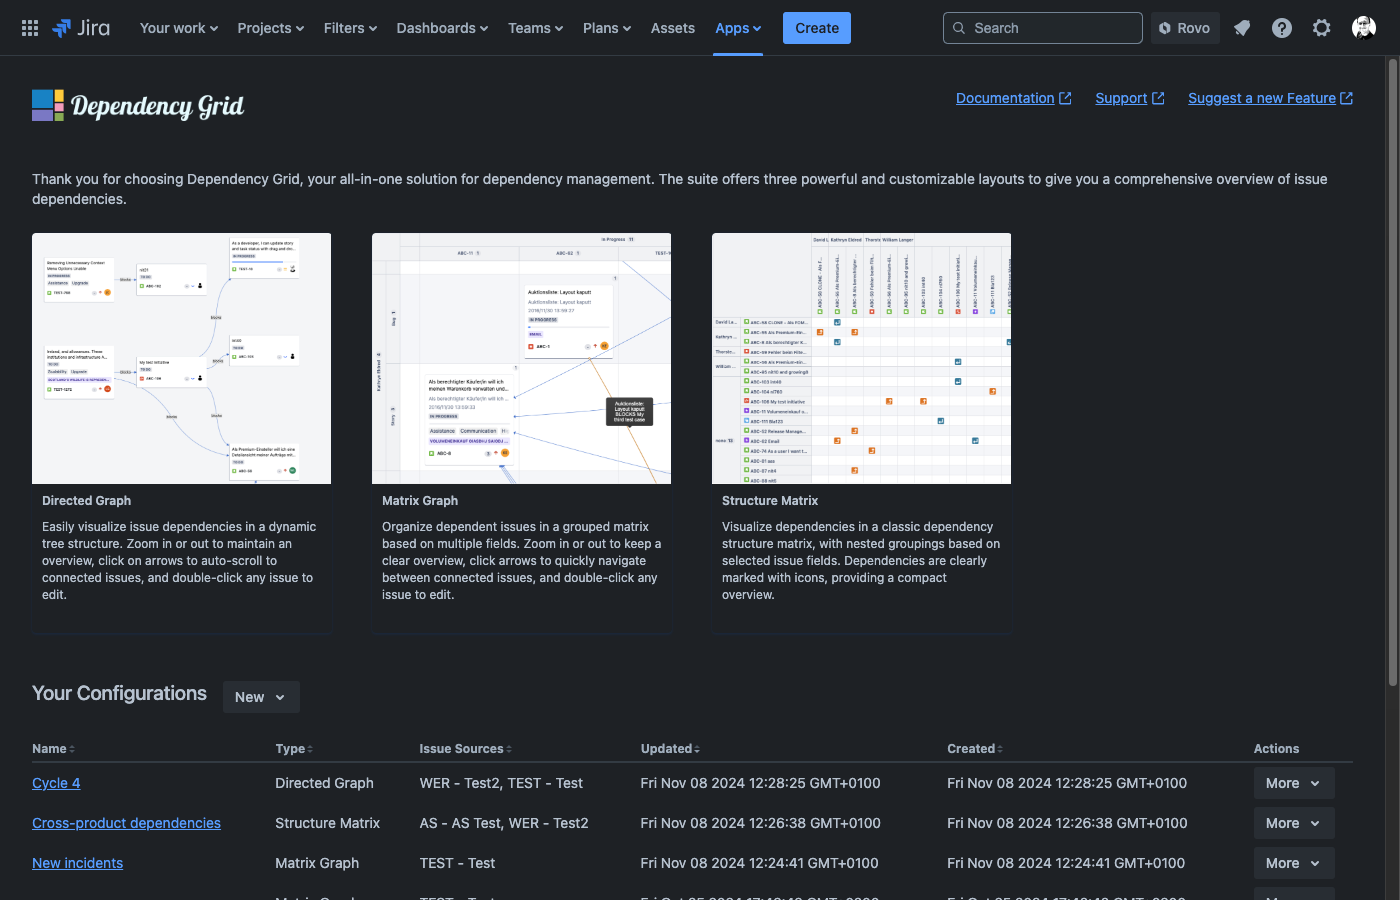 The Dependency Grid provides three visualization tools: Directed Graph, Matrix Graph and
Structured Matrix. To create a new dependency configuration, click on the teaser images or use the 'New'
dropdown menu.
The Dependency Grid provides three visualization tools: Directed Graph, Matrix Graph and
Structured Matrix. To create a new dependency configuration, click on the teaser images or use the 'New'
dropdown menu.
Matrix Graph
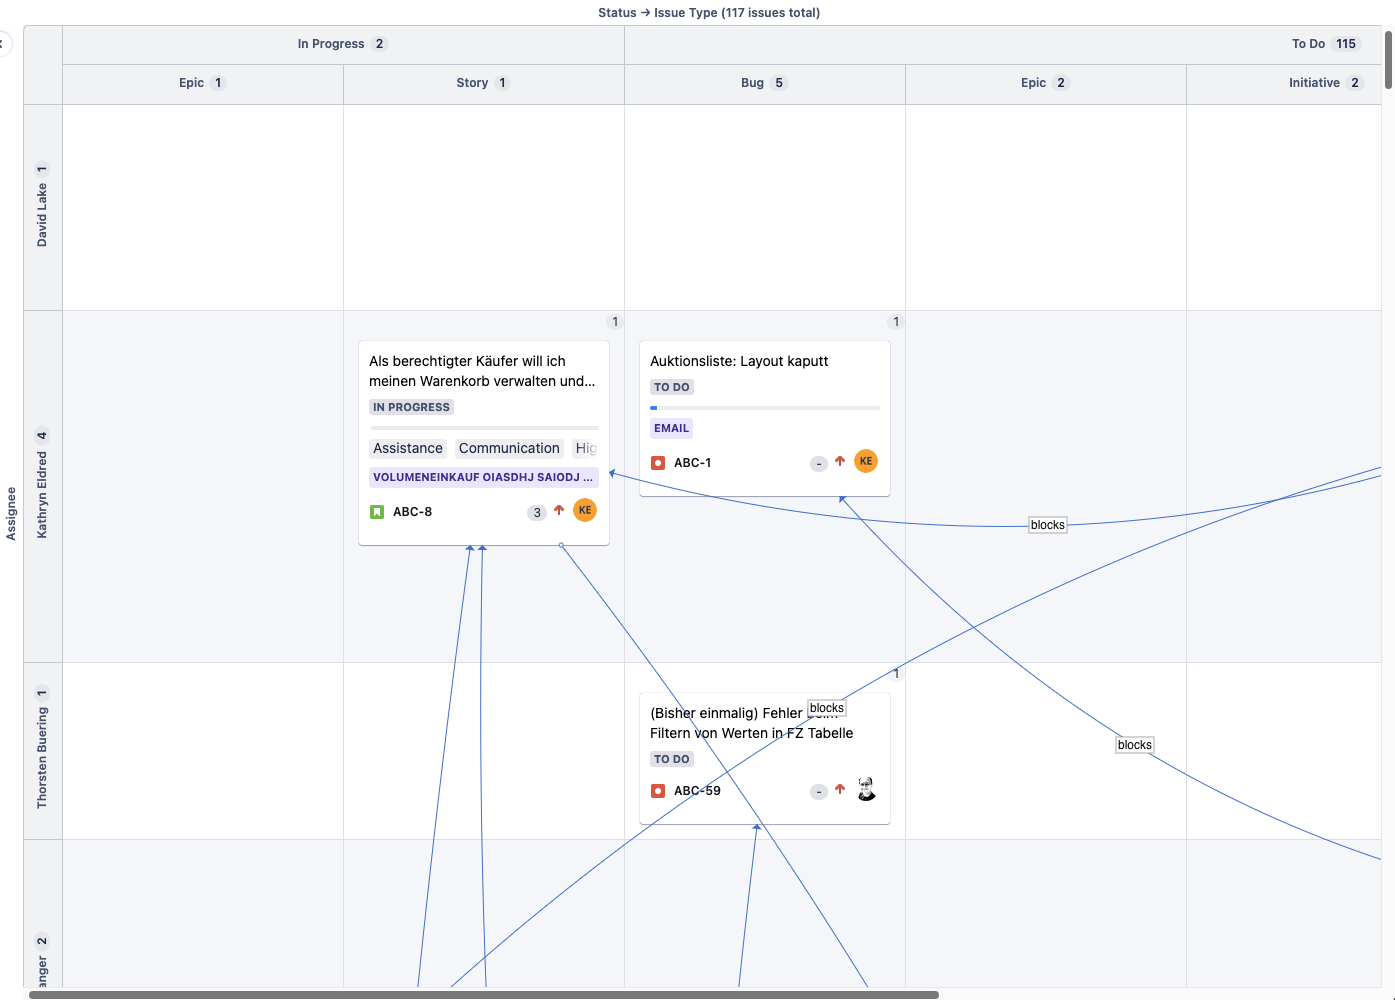
The Matrix Graph displays dependent issues as cards organized in a nested matrix based on the selected Jira fields, with labeled lines indicating dependency links.
Configuration
Use the form in the sidebar to configure the visualization. The sections below offer detailed guidance on each configuration option.
Issues
Select one or more Jira projects and/or board and custom filters to visualize the issues. By default, resolved or done issues are ignored. To include them, check the "Include resolved/done issues" option.
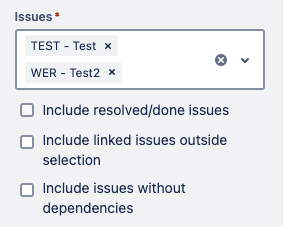
Checking the second option includes issues that are outside the selected projects and filters but have a dependency link to in-scope issues.
By default, only issues with dependencies are displayed. To include all other issues from the selected projects and filters, check the third option.
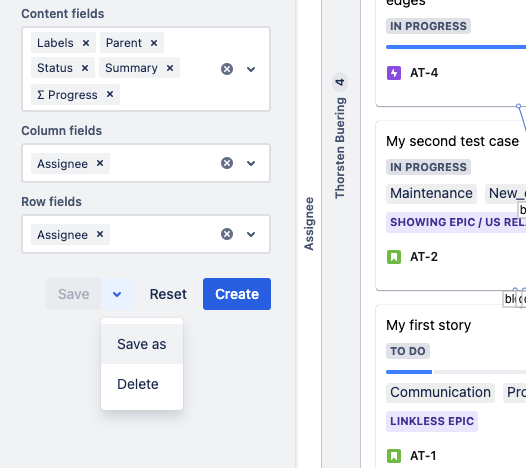
Content fields
Select which Jira fields to display on the card layout. Some issue values are automatically included in the content.
Column fields
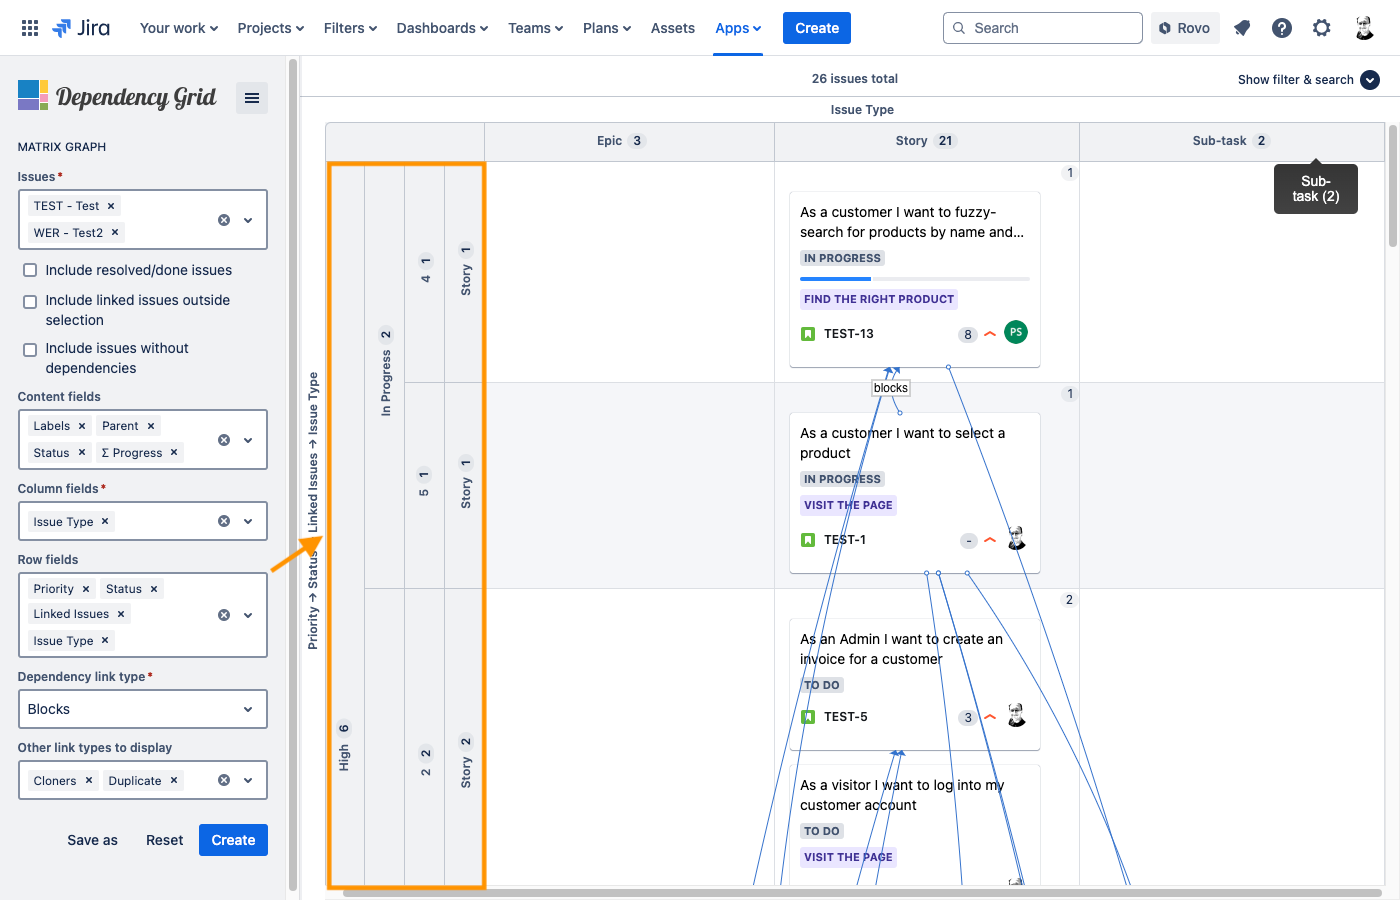
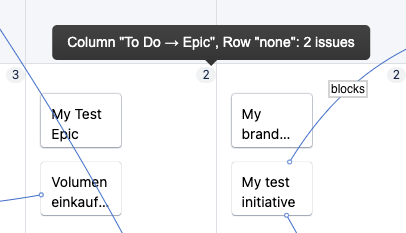
Select 1 to multiple Jira fields that create a tree-like header of nested value categories for the table columns. The nesting follows the order in which the Jira fields are selected. A summary of the column fields along with the total number of retrieved issues is displayed above the grid.
In the table header, for each column the number of contained issues is displayed as a badge next to the column label.
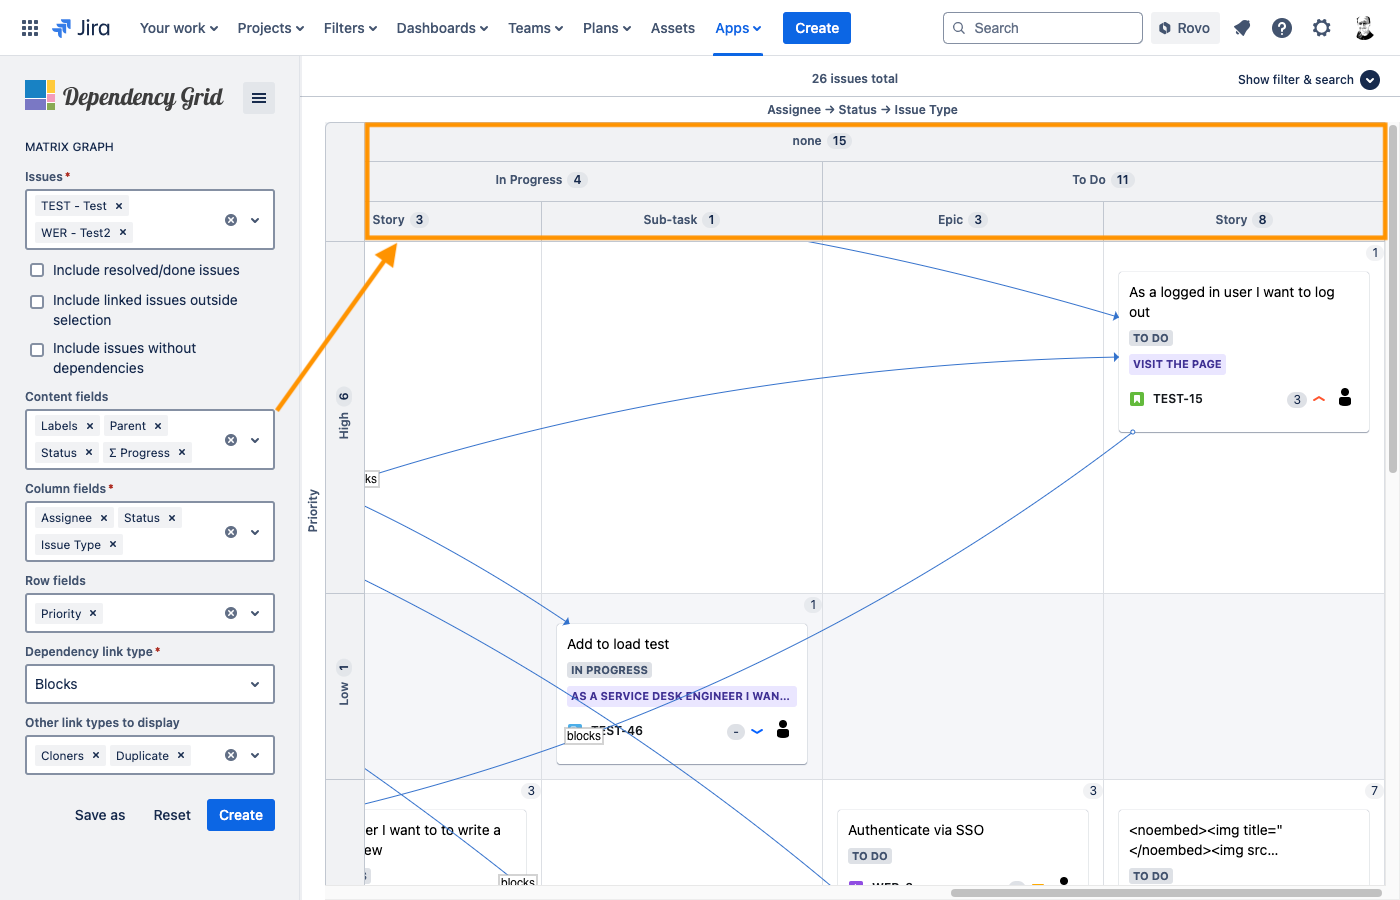
Row fields
Optionally, and analog to the Column fields, select one or more Jira fields for the table rows.
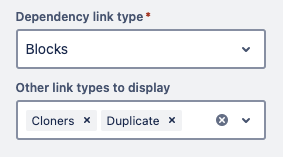
Link Types
By default, the dependency link type is set to 'Blocks'. If another link type is used to denote dependencies in the instance, it can be selected from the 'Dependency link type' control.
To display additional link types between in-scope issues, select them from the 'Other link types to display' control.
Interaction
Zooming
By default, the card layout displays all the selected Jira fields. To zoom in or out, hold the Alt key (Windows) or Option key (Mac) while scrolling. Zooming out reduces the card size, showing only as many issue details as fit within the available space; zooming in reveals more information. To pan the view, simply drag the visualization with your mouse.
View and Edit an Issue Details
Double-click an issue to open and edit it in a modal view. The card representation will be updated upon closing the modal.
Auto-Scolling between Dependent Issues
Double-click on a link to automatically scroll to the target issue in the direction of the link. If the target issue is already shown, the app scrolls to the source of the link
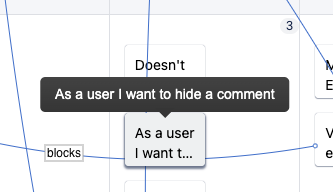
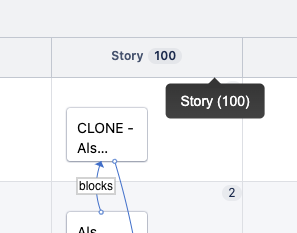
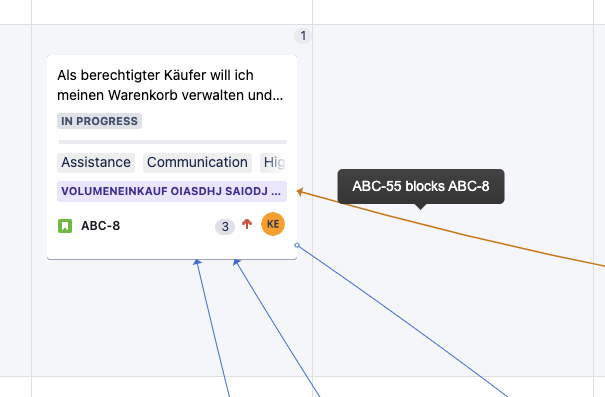
Tooltip
Hovering over cards, links and table headers reveals a tooltip that displays relevant information.
Directed Graph
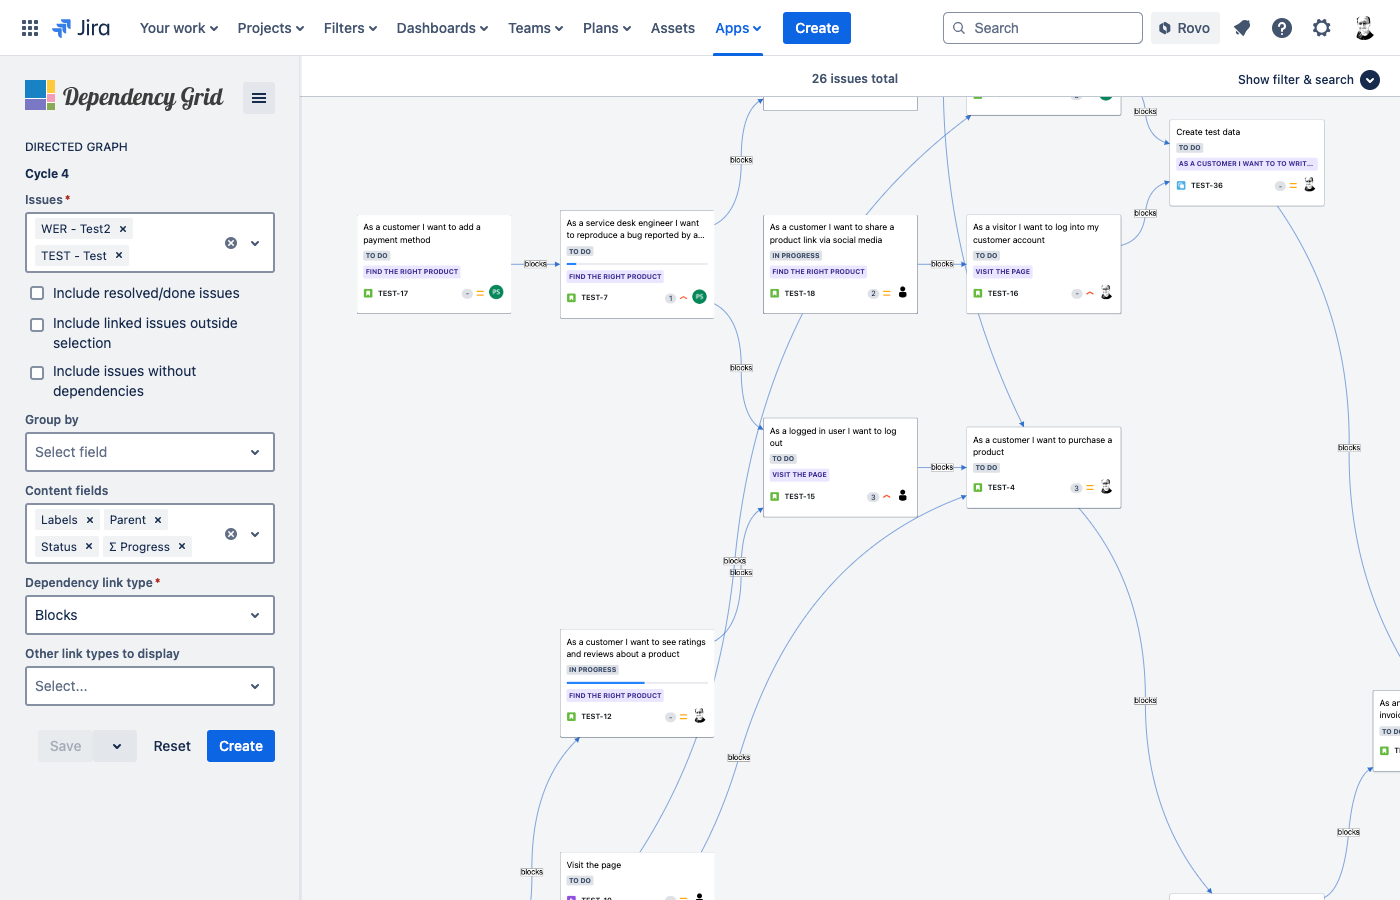
The Directed Graph displays dependent issues as cards arranged in a tree-like layout, with labeled arrows indicating the direction of dependencies. Additionally, the cards can be nested based on selected Jira fields.
Configuration
Use the form in the sidebar to configure the visualization. The sections below offer detailed guidance on each configuration option.
Issues
Select one or more Jira projects and/or board and custom filters to visualize the issues. By default, resolved or done issues are ignored. To include them, check the "Include resolved/done issues" option.
Checking the second option includes issues that are outside the selected projects and filters but have a dependency link to in-scope issues.
By default, only issues with dependencies are displayed. To include all other issues from the selected projects and filters, check the third option.
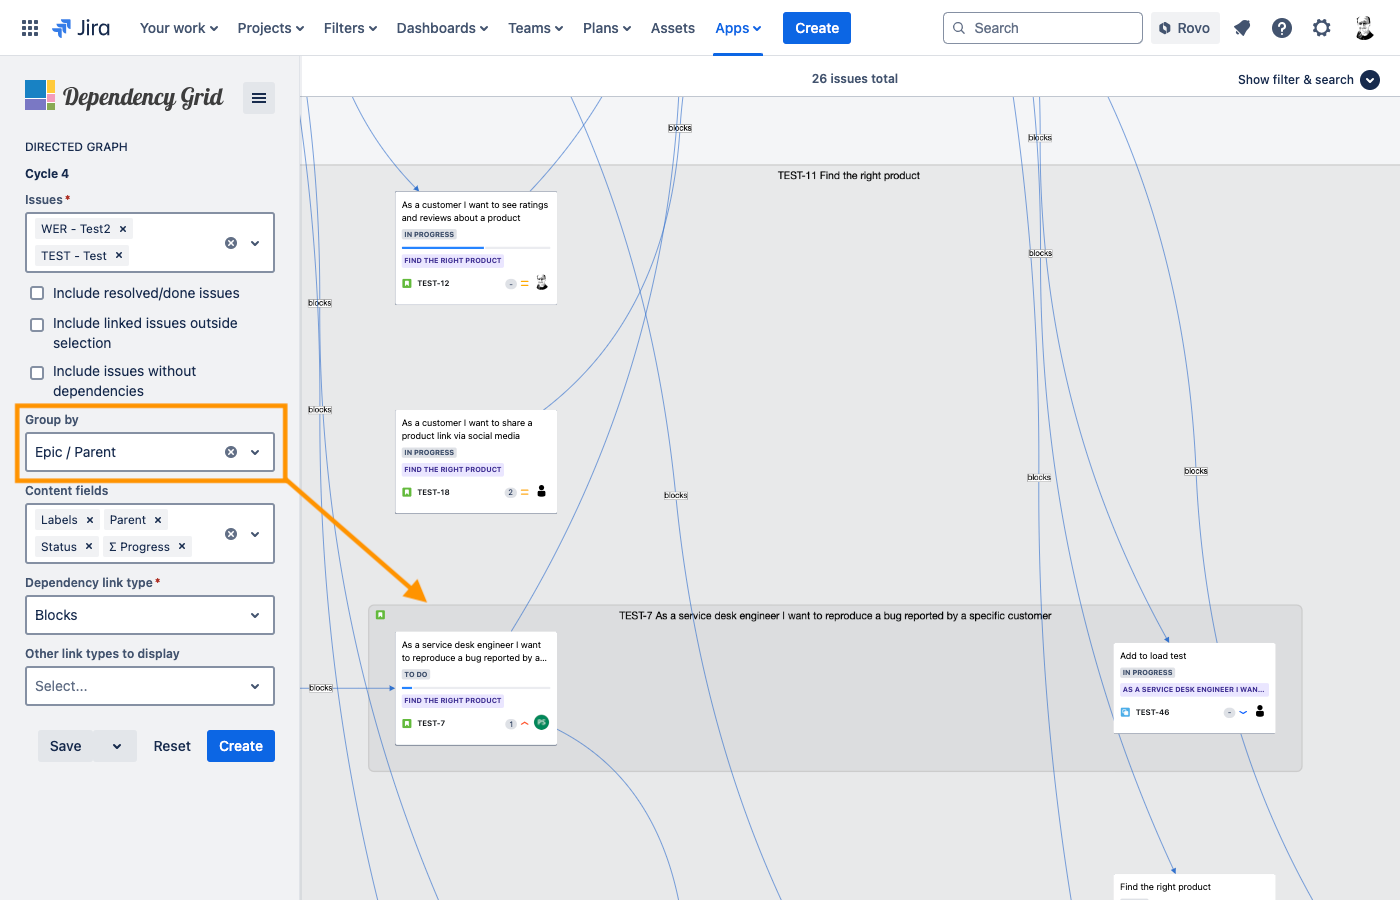
Group By
Use the 'Group by' control to select a Jira field for grouping and organizing issues in the graph. Available options include 'Epic/Parent', 'Fix versions', 'Priority', 'Project', 'Sprint', 'Status', 'Status Category', and 'Team'.
Content fields
Select which Jira fields to display on the card layout. Some issue values are automatically included in the content.
Link Types
By default, the dependency link type is set to 'Blocks'. If another link type is used to denote dependencies in the instance, it can be selected from the 'Dependency link type' control.
To display additional link types between in-scope issues, select them from the 'Other link types to display' control.
Interaction
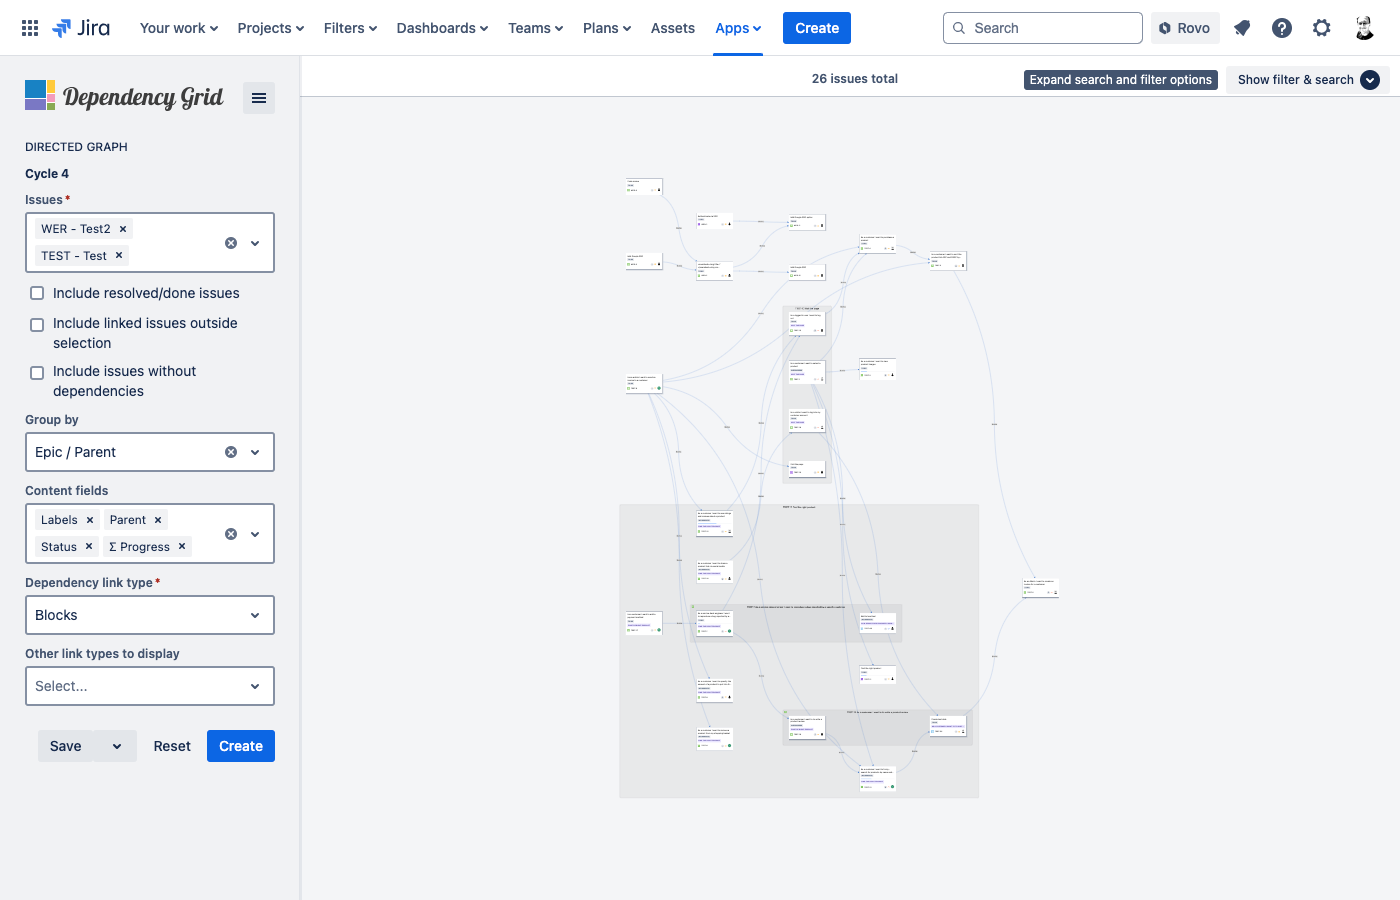
Zooming
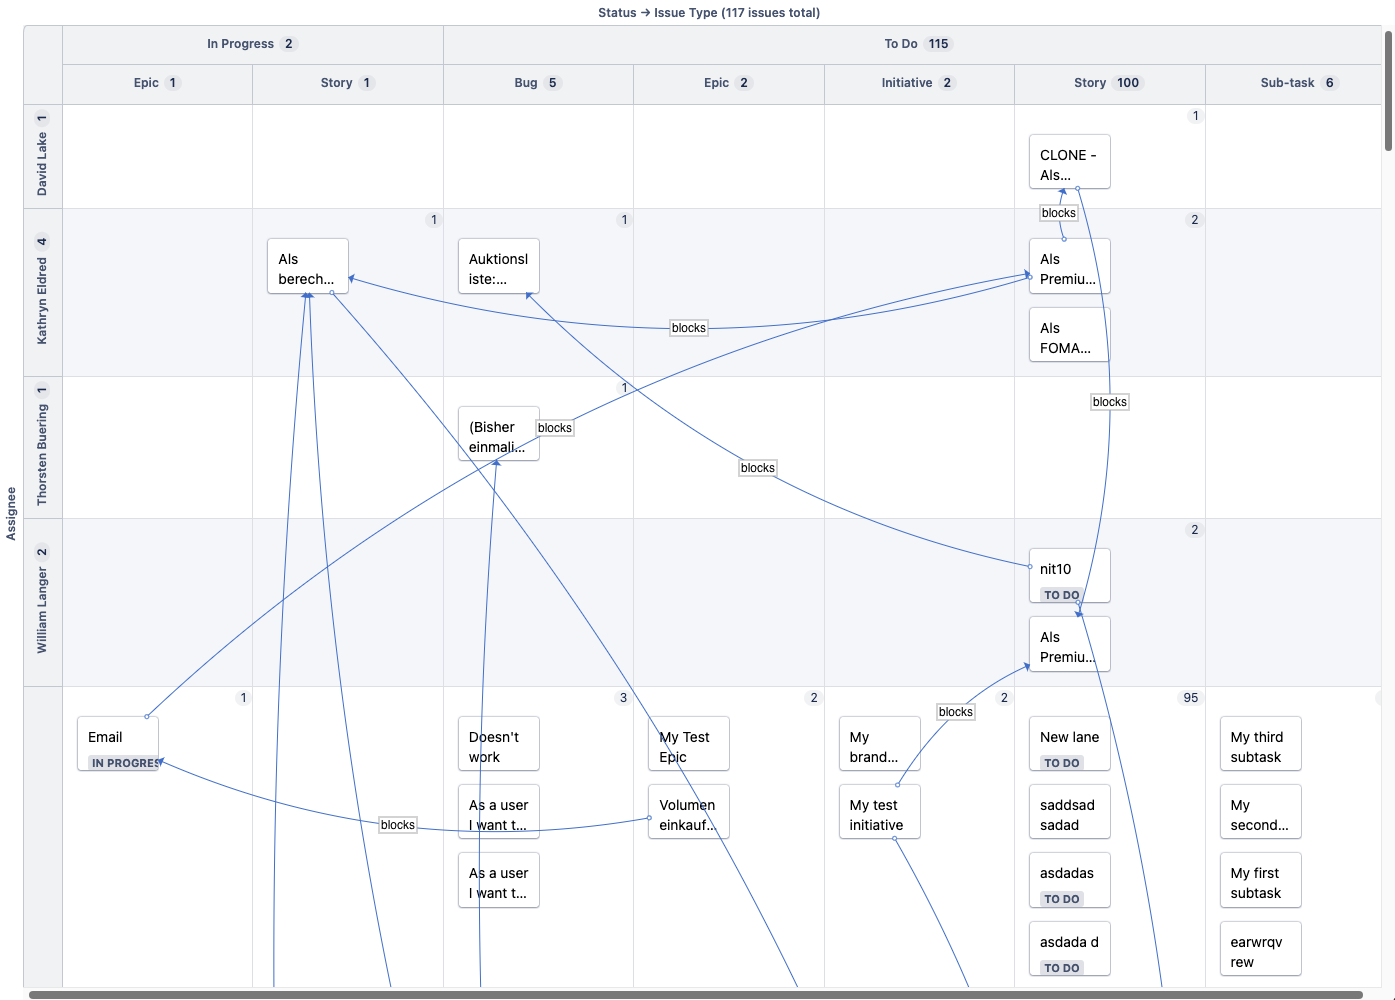
To zoom in or out, use your trackpad or mouse scroll. The graph size adjusts smoothly, making it easy to gain an overview (see the example below of a zoomed-out graph). To pan the view, click and drag the visualization with your mouse.
View and Edit an Issue Details
Double-click an issue to open and edit it in a modal view. The card representation will be updated upon closing the modal.
Auto-Scolling between Dependent Issues
Double-click on a link to automatically scroll to the target issue in the direction of the link. If the target issue is already shown, the app scrolls to the source of the link
Tooltip
Hovering over cards, links and table headers reveals a tooltip that displays relevant information.
Structure Matrix
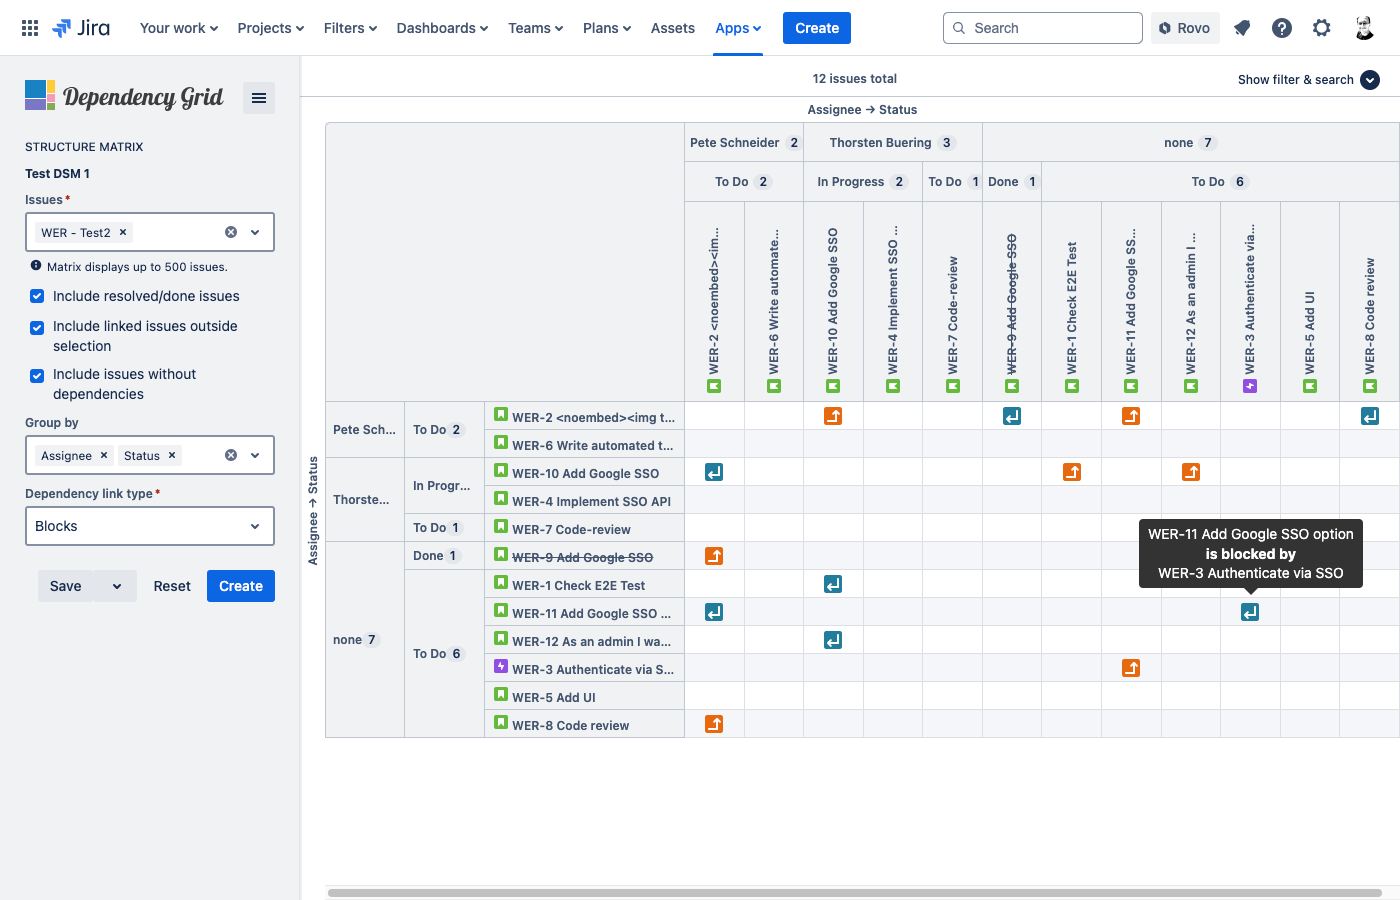
The Dependency Structure Matrix displays Jira issues along both the rows and columns of the matrix, with marked cells indicating dependencies and their direction between corresponding issues. Additionally, the rows and columns can be nested by selected Jira fields to group related issues.
Configuration
Use the form in the sidebar to configure the visualization. The sections below offer detailed guidance on each configuration option.
Issues
Select one or more Jira projects and/or board and custom filters to visualize the issues. By default, resolved or done issues are ignored. To include them, check the "Include resolved/done issues" option.
Please note that depending on the selected projects or filters, the matrix can become extremely large (e.g., 1,000 Jira issues would result in a matrix with 1 million cells). To prevent potential memory issues, the Dependency Structure Matrix is currently limited to displaying a maximum of 500 Jira issues.
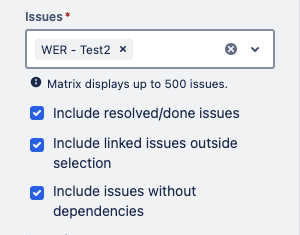
Checking the second option includes issues that are outside the selected projects and filters but have a dependency link to in-scope issues.
By default, only issues with dependencies are displayed. To include all other issues from the selected projects and filters, check the third option.
Group By
Use the 'Group by' control to select one or multiple Jira fields for grouping and organizing issues.
Depenendeny Link Type
By default, the dependency link type is set to 'Blocks'. If another link type is used to denote dependencies in the instance, it can be selected from the 'Dependency link type' control.
Interaction
Scrolling
For large graphs, both horizontal and vertical scrolling are supported. With sticky header rows and columns, you can easily navigate without losing your place.
View and Edit an Issue Details
Click an issue link to open and edit it in a modal view. The matrix will be updated upon closing the modal.
Tooltip
Hovering over table headers, links and depdency icons reveals a tooltip that displays relevant information.
Save and Manage Configurations
To save a configuration, click the save button and enter a name. All saved configurations will appear on the central start page. Select a configuration from the list to load it.
Use the save-as option from the split-button menu to save the current configuration under another name. To delete a configuration, first load it into the form, then select the delete option from the split-button menu.
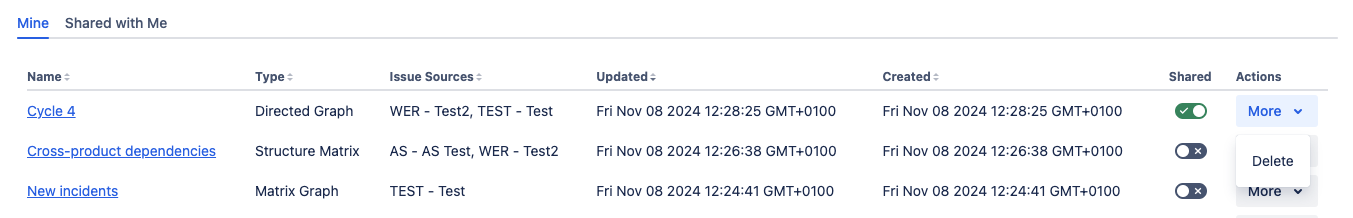
On the start page, you can share or unshare a configuration with other users in your Jira installation by toggling the share button. Configurations shared with you appear under the "Shared with Me" tab.
To delete a configuration, open the "More" menu and select the "Delete" option.
Missing a feature or encountered a bug? Just let us know! We are curious to learn how you use the app and what could be improved.